Last year, UN-Habitat and partners supported in the data collection for SDG 11.3.2 indicator that focuses on civic engagement in urban planning and management processes, which was at risk of being dropped from the SDG Global Database due to insufficient data –less than 30% of countries reported this indicator by 2023.
Significant progress was made in 2024 using a user-friendly data collection tool embedded in Our City Plans.The survey received 2,506 responses from 876 cities across 136 countries. However, 72% of the cities received only 1 or 2 responses (628 cities), yielding insufficient or non-representative data. To ensure reliability, thresholds for official results were established:
- City-level results require a minimum of 5 responses from at least 3 sectors (government, civil society, academia, private sector, or professional body).
- Country-level results require at least 3 cities with official city-level results.
Considering these thresholds, official results have been reported for 101 cities (from 49 countries) (city-level) and 9 countries (country-level) for 2024 (Image 1) -But this is still not enough. We need to add 300 more cities in the next 5 months.
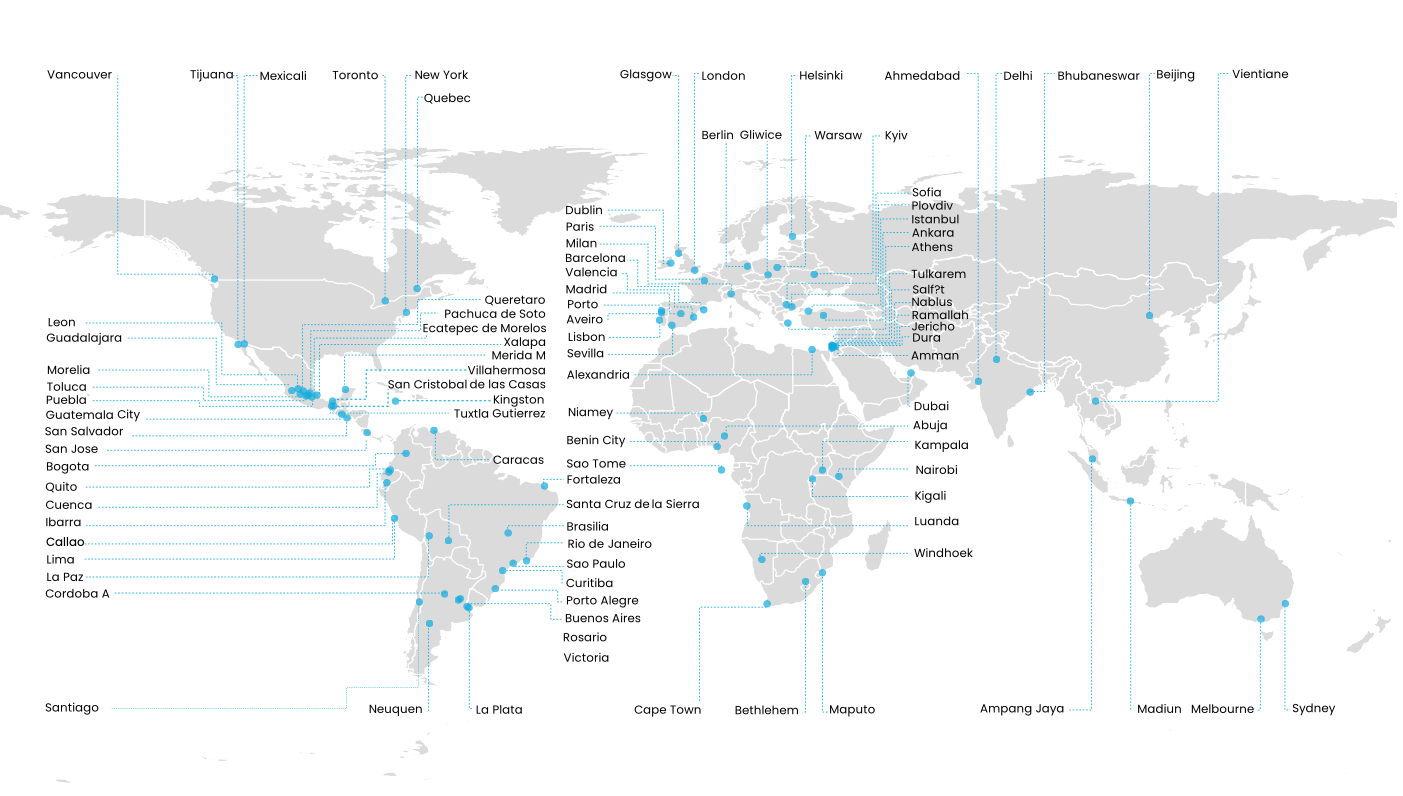
Image1. Map with cities with official scores for SDG 11.3.2 indicator. Source: 11.3.2 indicator survey results, considering a universe of 101 cities with official city-level results.
In terms of average city scores, percentages indicate the level of a direct participation structure of civil society in urban planning and management that operates regularly and democratically . Image 2 shows the number of cities with official scores for 2024 by region according to different categories — very low, low, and medium participation levels— according to the established classes (very low: 25.1-50%, low: 50.1-65%, medium: 65.1-85%). There was no city that achieved a high level of participation (average score of 85.1-100%), nor no participation at all (average score of 0-25%).
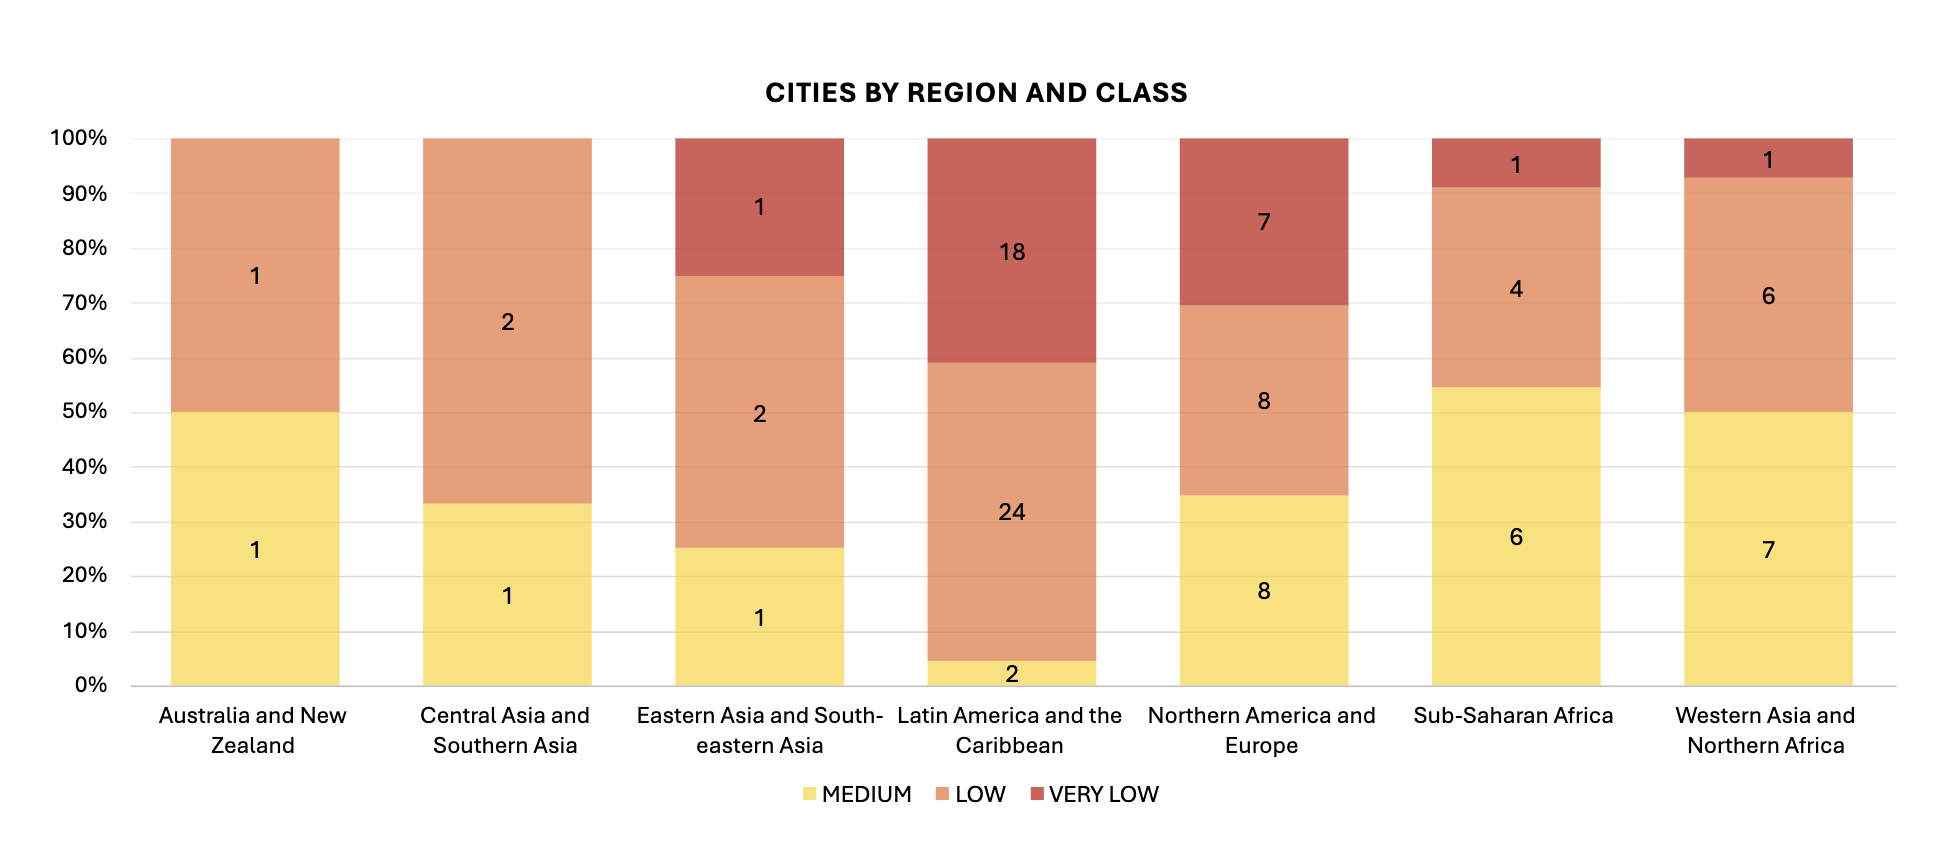
Image 2. Graph of the number of cities with official results by region, categorized by level of participation. Source: 11.3.2 indicator survey results, considering a universe of 101 cities with official city-level results.
The city official scores by region indicate a diverse distribution across continents. Latin America and the Caribbean had the highest number of cities, 44, contributing to 43% of the total. Northern America and Europe followed, accounting for 23 cities (23%). Western Asia and Northern Africa had 14 cities with official scores, representing 14% of the total. Meanwhile, Sub-Saharan Africa contributed with 11 cities (11%), and Central Asia and Southern Asia added 3 cities (3%). Australia and New Zealand had the lowest participation, with 2 cities, representing just 2% of the total of 101 cities.
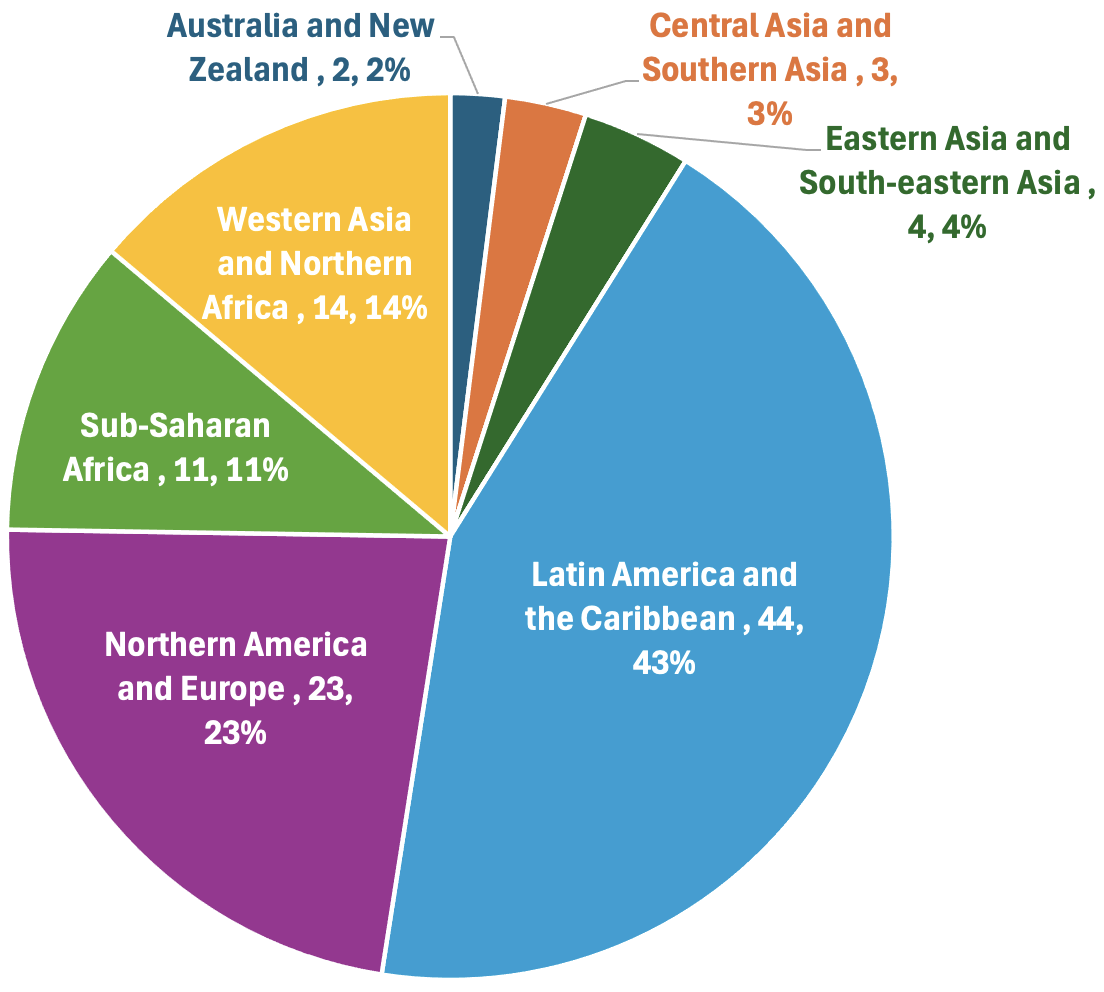
Image 2. Distribution of cities with responses by regions. Source: 11.3.2 indicator survey results, considering a universe of 101 cities with official city-level results.
The distribution of responses by sector showed notable variation, particularly for professional bodies, which had the lowest percentage of responses (10%). The highest number of responses came from civil society, contributing 27% of the total, followed by academia with 24%. Government accounted for 21%, while the private sector contributed 19% of the total responses.
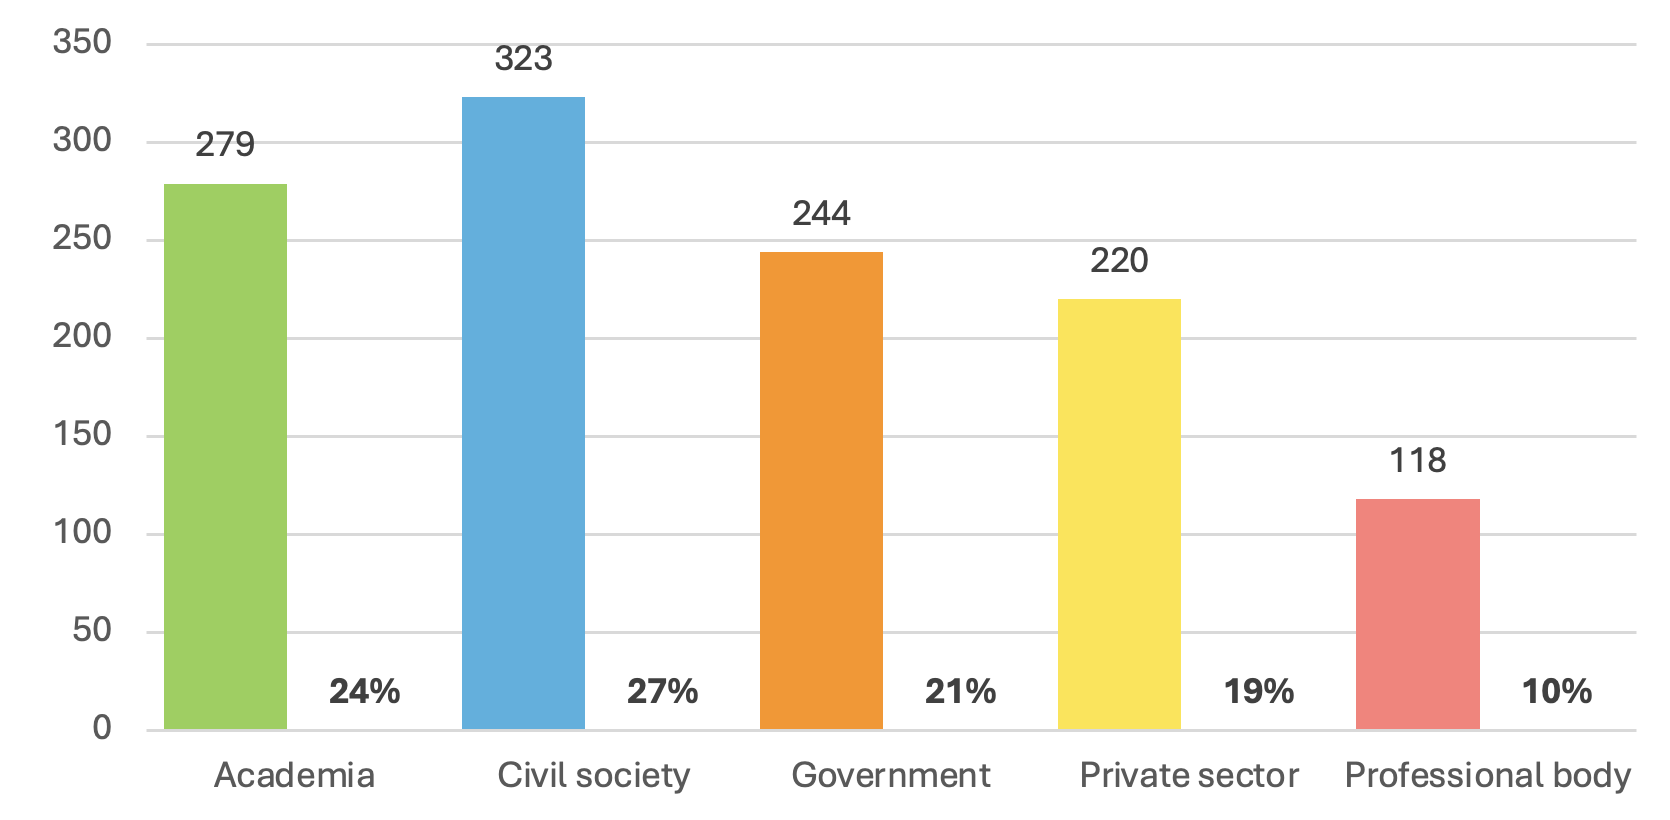
Image 3. Distribution of individual responses by sector. Source: 11.3.2 indicator survey results, considering a universe of individual responses from 101 cities with official city-level results.
Current status and next steps
Due to the efforts and progress made in 2024, we now have conditional approval for the indicator to not be dropped from the SDG Global Database, but we need to demonstrate an increase in the data coverage in the next 5 months: we need to add 300 more cities with official results. Help us gather more data and add more cities with official results to the map above. We urge you to respond to the survey and share it among stakeholders and partners in the cities which still do not have official results. Find the full list of cities that have less than 5 responses from less than 3 sectors here -we only need a few more responses in each one!
Saving this indicator will highlight that participation in urban planning, management and decision-making processes, that includes different sectors and population groups, is key to guarantee that all voices are heard, and that sustainable urban development responds to everyone's needs.